Originally published on the SoraNova blog.
I’ve been building an AI research assistant for venture capitalists, and I want to tell you about it. Not because it’s perfect (it’s not), but because the journey from “let’s make a simple search wrapper” to “oh god, we have five specialized agents and a hierarchical citation system” taught me a lot about what it actually takes to build useful AI systems in 2025.
This is the story of the deep research workflow - a system that went through four major architectural iterations, burns through hundreds of thousands of tokens per research session, and somehow manages to produce genuinely useful investment research. Let me show you what I learned.
The Deceptively Simple Goal
The original pitch was straightforward: “We need to prepare for VC meetings. Can we get AI to do the research?”
Sure! Just call GPT-4 with some search results, right?
Here’s what we actually needed:
- Research that covers factual data (funding, metrics, team), technical details (architecture, moats), market dynamics, and risks
- Citations for everything because VCs don’t trust unsourced claims
- The ability to identify gaps in research and fill them automatically
- Output structured in a specific format (meeting prep sheets, not essays)
- Cost tracking because this gets expensive fast
- Transparency into what the system is doing
Let me show you how we got there.
Version 1: The Single Agent That Could
The first version was… optimistic. One orchestrator agent, sequential processing, and a lot of hope. The flow was:
- Phase 1: Figure out what to research (intent analysis)
- Phase 2: Search the web and local KB
- Phase 3: Loop until we’ve covered everything - gap analysis and additional searches
- Phase 4: Synthesize into a report
- Phase 5: Transform to user’s schema
This actually worked! For about two weeks. Then we noticed:
- The research was shallow. One agent trying to cover financials, tech, market, team, and risks? Pick two.
- No specialization. The same prompt had to work for “What’s their tech stack?” and “What are the red flags?”
- Sequential bottleneck. Why are we waiting for financial research to finish before starting market research?
Time for V2.
Version 2: The Specialist Squad
What if, instead of one generalist agent, we had a team of specialists?
We created five specialized agents:
- Factual: Funding, metrics, timeline
- Technical: Architecture, tech moats
- Market: TAM/SAM/SOM, competition
- Team: Leadership, track record
- Risk: Red flags, concerns
Each agent got its own specialized prompt. Here’s a taste of the factual agent:
You are a factual research specialist focused on financial metrics and quantitative data.

CRITICAL CITATION REQUIREMENTS:
- For EVERY fact, metric, or claim, you MUST cite the source URL
- DO NOT make claims without supporting citations

Your primary goals:
- Extract and verify financial metrics (revenue, growth, burn rate, runway)
- Document funding history and valuations with exact figures
- Create accurate timelines of company milestones
- Verify all data points with multiple sources when possible
The results? Night and day. Each agent got really good at its specialty. The factual agent learned to dig up funding data from Crunchbase, PitchBook, and SEC filings. The risk agent developed a nose for red flags in Glassdoor reviews and Reddit threads.
But we had a new problem: coordination overhead. The coordinator had to understand what each specialist found and weave it together. Sometimes agents would contradict each other. Sometimes they’d miss the bigger picture.
Version 3: Configuration-Driven Workflows
By V3, we had learned enough to want declarative configuration. What if we could define agents in YAML instead of Python?
# orchestrator_config.yaml (simplified)
blocks:
  - name: "factual_researcher"
    agent:
      specialization_prompt: |
        You are a factual research specialist...

      llm:
        model: "gpt-4.1"

      on_end:
        model: "deep_research.schema.schemas.AgentResearchResponse"
        prompt: |
          Provide structured response with:
          1. summary
          2. key_findings
          3. citations (ALL sources with URLs)
          4. confidence_score

      evaluator:
        type: deepeval
        metrics:
          factual_accuracy:
            weight: 0.4
            threshold: 0.5
            criteria: |
              Verify factual claims about funding, valuation, revenue...
This was powerful. We could now:
- Define agents without code changes
- Configure evaluation metrics per agent
- Experiment with different LLM models per task
- Version control our agent definitions
But the real magic was in the evaluation framework. Each agent got graded on metrics that mattered:
- Factual Agent: factual_accuracy (40%), data_completeness (25%), source_reliability (20%), metric_precision (15%)
- Technical Agent: technical_depth (35%), innovation_assessment (25%), architecture_quality (20%)
- Market Agent: market_understanding (30%), competitive_insights (30%), trend_accuracy (20%)
The system would run research, evaluate the output, and if metrics didn’t pass thresholds, it would automatically iterate with improved prompts. This was our first taste of self-improving research.
Version 4: Agent Runtime and MCP Integration
Then came the final evolution: integrating with the Agent Runtime framework and Model Context Protocol (MCP) servers.
MCP is Anthropic’s protocol for connecting AI models to external tools and data sources. Instead of hardcoding “use Exa for search” or “use this specific API,” we could create a workflow engine that loads configuration and automatically discovers available tools from MCP servers (Exa, web browsers, local KB, etc.).
The beautiful thing about MCP is tool discovery. Agents don’t need to know about specific APIs. They describe what they need, and the MCP framework finds the right tool:
# Agent defines what it wants to do
- name: "Search financial data"
  tool_call:
    web_search:
      engine: "auto"  # MCP picks the best search provider
    arguments:
      - '"{{ company_name }}" funding "series A" valuation'
    execution:
      mode: "parallel"
      max_concurrent: 3
This gave us:
- Flexibility: Swap search providers without code changes
- Resilience: Automatic fallback if one tool fails
- Extensibility: Add new tools just by adding MCP servers
The Citation Problem
Let’s talk about citations. Early on, we thought: “Just ask the LLM to cite sources!”
The LLM, cheerfully: “According to recent reports, the company raised $50M [1].”
Us: “What’s [1]?”
The LLM: “Oh, that? I made it up. Seemed like something there should be a citation for.”
This is where we learned that citations are hard. Like, really hard. We ended up building a two-tier system:
Tier 1: Sentence-Level Citations
Every claim gets a citation marker. We parse the LLM output and match citations to specific sentences using semantic similarity to find supporting citations from the research sources, then add inline citation markers.
Tier 2: Report-Level Reference Section
At the end of the report, we generate a proper bibliography:
## References

[1] "Company X raises $50M Series B" - TechCrunch, June 2024
    https://techcrunch.com/2024/06/company-x-series-b

[2] "Analyzing Company X's market position" - CB Insights, May 2024
    https://cbinsights.com/research/company-x-analysis
The tricky part? Deduplication. If three agents all cite the same Crunchbase page, we want ONE reference, not three. We built a citation deduplicator using URL normalization (removing tracking params, fragments, etc.) and content hashing for similarity detection.
The Research Loop: Iterative Refinement
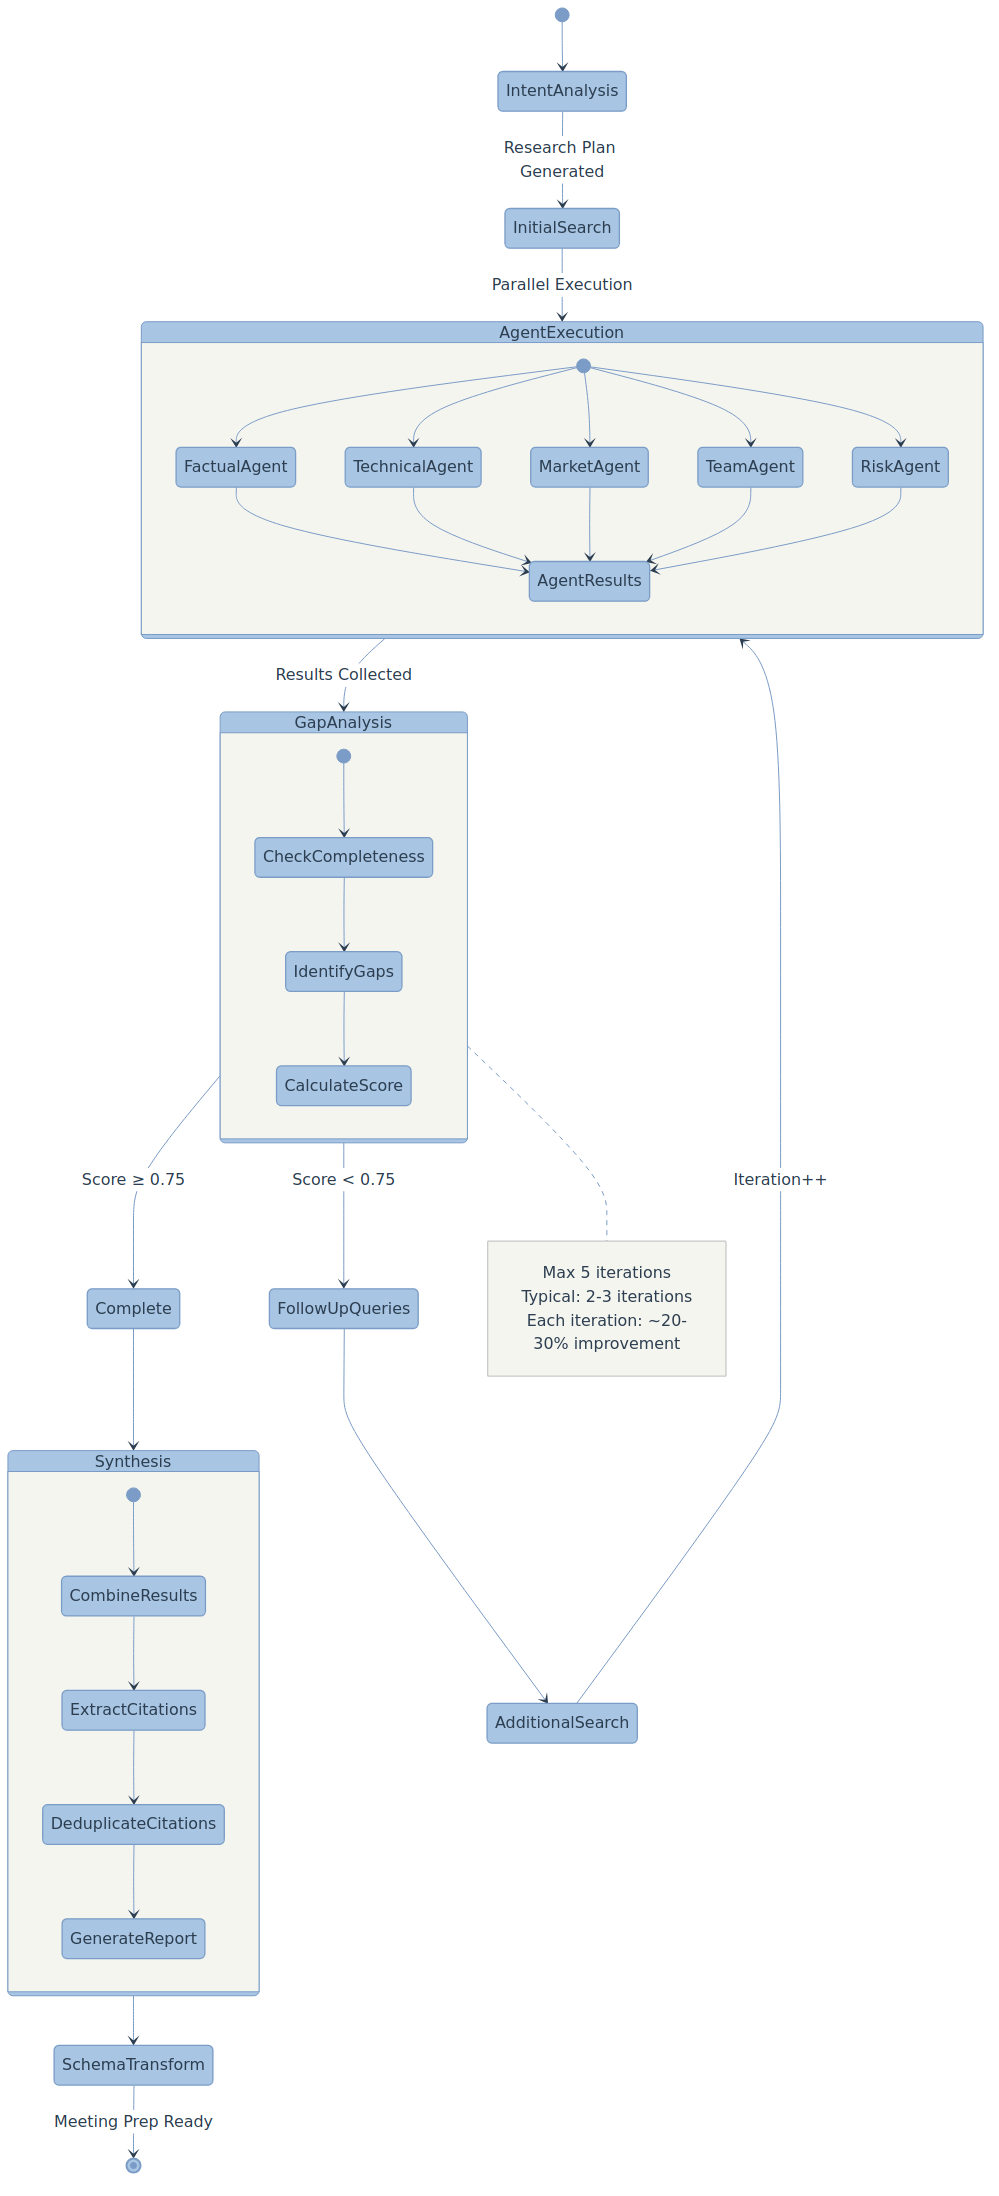
One of the coolest parts is the research loop. After the initial search, we don’t just call it done. We ask: “What are we missing?”
The process works like this:
- Analyze what we have (gap analysis)
- If completeness score >= threshold, we’re done
- Otherwise, generate follow-up queries based on identified gaps
- Search for missing information
- Update the report and repeat
The gap analyzer uses a structured prompt:
Analyze the research findings for completeness. For a VC meeting preparation, we need:

REQUIRED SECTIONS:
- Company Overview (founding, stage, location)
- Funding History (rounds, amounts, valuations, investors)
- Business Metrics (revenue, growth, unit economics)
- Market Analysis (TAM/SAM/SOM, competition)
- Technical Assessment (product, architecture, moats)
- Team Evaluation (founders, key hires, track records)
- Risk Assessment (red flags, concerns)

CURRENT FINDINGS:
{current_findings}

Identify what's missing or insufficiently covered. Rate completeness 0-1.
In practice, we typically see 2-3 iterations before hitting the threshold. Each iteration makes the research ~20-30% more complete.
Token Tracking: Because This Isn’t Free
Let’s talk money. A full research run can easily consume 200K-500K tokens. Based on our model mix (GPT-5 for synthesis, GPT-4.1 for agents, GPT-4o-search for web queries), that’s roughly $2-3 per company researched.
We built comprehensive token tracking to understand where the cost comes from. Each operation logs the model used, prompt/completion tokens, cost, and timestamp. This allows us to generate detailed cost breakdowns.
Typical breakdown for one research session:
Operation                  | Tokens    | Cost
---------------------------|-----------|-------
Intent Analysis (GPT-5)    | 7,000     | $0.03
Initial Web Search         | 188,000   | $1.08
  - Factual (4o-search)    | 45,000    | $0.26
  - Technical (4o-search)  | 38,000    | $0.22
  - Market (4o-search)     | 42,000    | $0.24
  - Team (4o-search)       | 35,000    | $0.20
  - Risk (4o-search)       | 28,000    | $0.16
Gap Analysis (4.1-nano)    | 42,000    | $0.01
Synthesis (GPT-5)          | 78,000    | $0.34
Schema Transform (GPT-5)   | 46,000    | $0.20
Citation Extract (4o-mini) | 28,000    | $0.01
---------------------------|-----------|-------
Total                      | 389,000   | $1.67
Note: Costs vary based on actual input/output token ratios. A complex research run with multiple gap analysis iterations can reach $2.50-3.00.
We optimized by:
- Using smaller models where possible: Gap analysis uses gpt-4.1-nano ($0.10/$0.40 per 1M) instead of gpt-5 ($1.25/$10 per 1M)
- Caching: Query deduplication prevents redundant searches
- Context management: Truncate old results when approaching token limits
- Parallel execution: Search in parallel, pay once instead of sequentially
- Smart model selection: Citation extraction uses gpt-4o-mini ($0.15/$0.60) instead of gpt-5
Model Selection: The Right Tool for the Job
We have a YAML config defining all our models and their costs:
# config/models.yaml (actual pricing)
models:
  gpt-5:
    context_window: 400000
    max_output_tokens: 128000
    costs:
      input_per_1M: 1.25
      output_per_1M: 10.00

  gpt-4.1:
    context_window: 1047576
    max_output_tokens: 32768
    costs:
      input_per_1M: 2.00
      output_per_1M: 8.00

  gpt-4.1-nano:
    context_window: 1047576
    max_output_tokens: 32768
    costs:
      input_per_1M: 0.10
      output_per_1M: 0.40

  gpt-4o-search-preview:
    context_window: 128000
    max_output_tokens: 16384
    costs:
      input_per_1M: 2.50
      output_per_1M: 10.00
    search_context_size: high  # Can be low/medium/high

  gpt-4o-mini:
    context_window: 128000
    max_output_tokens: 16384
    costs:
      input_per_1M: 0.15
      output_per_1M: 0.60
The Evaluation Framework: Making It Better
The newest addition is automatic evaluation. After generating a report, we run it through DeepEval metrics:
evaluator:
  type: deepeval
  metrics:
    completeness:
      weight: 0.25
      threshold: 0.5
      criteria: |
        Evaluate the COMPLETENESS of the research output.
        Focus on coverage and breadth across all required sections.

      evaluation_steps:
        - "Check presence of all required sections"
        - "Assess level of detail in each section"
        - "Identify critical gaps for VC decision-making"

      rubrics:
        - [0.9, 1.0, "All sections with substantial detail"]
        - [0.7, 0.9, "All sections but some lack depth"]
        - [0.5, 0.7, "Missing minor sections"]
        - [0.0, 0.5, "Major sections missing"]
Each agent gets evaluated on metrics that matter for its specialty. The factual agent gets graded on factual_accuracy and metric_precision. The risk agent gets graded on risk_coverage and red_flag_detection.
If metrics don’t pass, we automatically generate an improvement iteration. The system generates an improvement prompt based on the original output, evaluation results, and failed criteria, then the agent re-runs the research with that enhanced prompt. Finally, we re-evaluate the improved output.
This typically improves scores by 15-25% on the first improvement iteration.
What I Learned
Building this taught me several things about AI systems:
1. Specialization > Generalization
One generalist agent will never be as good as five specialists. The cognitive load of “be good at everything” is too high, even for frontier models.
2. Structure Beats Cleverness
We spent weeks on clever prompts. Then we added structured output schemas and everything got better. Using structured models (like Pydantic) with fields for summary, key findings, citations, confidence score, and metadata ensures agents can’t forget to include citations or return unstructured nonsense.
3. Iteration Is Not Optional
The first search results are never enough. The first synthesis is never complete. Build loops into your system from day one.
4. Observability Is Critical
Without phase logging and token tracking, we’d be flying blind. When you can’t step through the code (because it’s LLM calls), you need comprehensive logging.
Real-World Results
So does it work? Here’s a real example (anonymized):
Input: “Research CompanyX for VC meeting”
Output (full report):
# CompanyX - VC Meeting Preparation Report
Generated: November 20, 2025 | Research Time: 4m 23s | Cost: $2.34

---

## Executive Summary

CompanyX is a Series A B2B SaaS platform in the developer security tools space, showing strong early traction with 340% YoY growth and $3.2M ARR. Founded by experienced operators from Google and Stripe, the company has raised $17.5M to date at a $60M valuation. While technical moats and market positioning are strong, burn rate concerns and competitive pressure warrant careful evaluation.

**Key Investment Highlights:**
- Strong founder pedigree (Google Search Infrastructure + Stripe founding team)
- 340% YoY growth with improving unit economics
- Differentiated technical approach using runtime analysis vs static scanning
- $47B TAM with clear path to $820M SOM

**Key Concerns:**
- High burn multiple (3.0x) with 18-month runway
- Intense competition from well-funded incumbent
- Single product concentration risk

---

## Company Overview

**Founded:** January 2022
**Headquarters:** San Francisco, CA
**Stage:** Series A
**Employees:** 32 (as of Q4 2024) [1]
**Website:** companyx.com

### Founders

**Jane Doe - CEO & Co-founder** [2]
- Previously: Tech Lead, Google Search Infrastructure (2016-2021)
- Led team of 40+ engineers on search ranking systems
- Stanford CS (BS '12, MS '14)
- Published researcher in distributed systems

**John Smith - CTO & Co-founder** [3]
- Previously: Founding Engineer #8 at Stripe (2013-2021)
- Built core payment processing infrastructure
- MIT CS (BS '11)
- Known for technical blog posts on system design

### Company Timeline [4]

- **Jan 2022**: Company founded, entered Y Combinator W22
- **Mar 2022**: Beta launch with 5 design partners
- **Aug 2022**: Closed $2.5M seed round
- **Oct 2022**: General availability launch
- **Feb 2023**: Reached $500K ARR
- **Jun 2023**: Launched enterprise tier
- **Dec 2023**: Crossed $1M ARR, 25 employees
- **Mar 2024**: Closed $15M Series A
- **Jun 2024**: Launched API scanning module
- **Nov 2024**: Current - $3.2M ARR, 32 employees

---

## Funding History & Financials

### Funding Rounds

**Seed Round - August 2022** [5]
- Amount: $2.5M
- Valuation: $10M post-money
- Lead: Accel (Sarah Johnson)
- Participants: Y Combinator, several angels including former Stripe VP Engineering

**Series A - March 2024** [6]
- Amount: $15M
- Valuation: $60M post-money
- Lead: Sequoia Capital (Mike Chen)
- Participants: Accel (follow-on), Homebrew, Operator Collective
- Notable: Oversubscribed round, turned away additional $8M

**Total Raised:** $17.5M

### Financial Metrics (Q4 2024) [7]

**Revenue Metrics:**
- ARR: $3.2M (up from $1.2M in Q4 2023)
- MRR: $267K
- Growth Rate: 340% YoY, 22% QoQ
- Customer Count: 124 companies
- Average Contract Value (ACV): $25,800
- Net Revenue Retention: 132%

**Unit Economics:**
- CAC: $8,400 [8]
- LTV: $72,000 (assumes 36-month lifetime, 10% churn)
- LTV:CAC Ratio: 8.6x
- Gross Margin: 82%
- Payback Period: 11 months

**Burn & Runway:**
- Monthly Burn: ~$800K [9]
- Cash on Hand: ~$14.2M (estimated from Series A + burn)
- Runway: 18 months at current burn
- Burn Multiple: 3.0 (concerning - indicates $3 burned per $1 ARR added)

### Customer Breakdown [10]

**By Size:**
- Enterprise (>1000 employees): 12 customers, 48% of ARR
- Mid-market (100-1000): 35 customers, 38% of ARR
- SMB (<100): 77 customers, 14% of ARR

**By Industry:**
- Fintech: 35%
- Healthcare Tech: 22%
- E-commerce: 18%
- Other B2B SaaS: 25%

**Notable Customers:** [11]
- PaymentCo (Fortune 500 fintech)
- HealthTech Inc (unicorn, $2B valuation)
- RetailX (public company, $500M revenue)

---

## Market Analysis

### Market Size [12]

**TAM (Total Addressable Market): $47B**
- Global cloud security market growing at 18% CAGR
- Expected to reach $75B by 2028

**SAM (Serviceable Addressable Market): $8.2B**
- Developer security tools segment
- Includes SAST, DAST, SCA, API security
- Growing at 24% CAGR (faster than broader market)

**SOM (Serviceable Obtainable Market): $820M**
- Initial target: DevOps/Platform Engineering teams at mid-market and enterprise companies
- Focus on companies with 100-5000 developers
- Estimated 32,000 target companies globally
- Average potential contract: $25K

### Competitive Landscape [13]

**Direct Competitors:**

1. **CompetitorA (Market Leader)** [14]
   - Market Share: 32%
   - Founded: 2016
   - Funding: $420M (last valued at $2.8B)
   - Strengths: Brand recognition, broad feature set, large sales team
   - Weaknesses: Legacy architecture, slow innovation, expensive
   - Customer feedback: "Powerful but complex, steep learning curve" [15]

2. **CompetitorB (Fast Grower)** [16]
   - Market Share: 18%
   - Founded: 2019
   - Funding: $180M (last valued at $1.1B)
   - Strengths: Modern UI, good developer experience
   - Weaknesses: Limited enterprise features, accuracy issues
   - Customer feedback: "Easy to use but misses critical vulnerabilities" [17]

3. **CompetitorC (Legacy Player)** [18]
   - Market Share: 14%
   - Founded: 2011
   - Public company, $320M revenue (2023)
   - Strengths: Enterprise relationships, compliance features
   - Weaknesses: Dated technology, poor UX
   - Customer feedback: "Works but feels like software from 2015" [19]

**CompanyX Differentiation:** [20]
- Runtime analysis approach (competitors mostly do static analysis)
- 40% higher accuracy on OWASP Top 10 vulnerabilities (per internal benchmarks)
- Developer-first workflow (CI/CD native, not bolt-on)
- Lower false positive rate (claimed 60% reduction vs CompetitorA)

### Market Trends [21]

**Tailwinds:**
- Increasing security breaches driving demand (23% YoY increase in reported incidents)
- Shift-left security becoming standard practice
- Regulatory pressure (SOC2, ISO 27001, upcoming EU Cyber Resilience Act)
- DevSecOps adoption accelerating post-COVID

**Headwinds:**
- Market consolidation (CompetitorA acquiring smaller players)
- Economic uncertainty leading to longer sales cycles
- Security budget scrutiny (platform consolidation preference)

---

## Technical Assessment

### Product Overview [22]

CompanyX's platform provides automated security analysis for application code and APIs. Core capabilities:

1. **Runtime Security Analysis**
   - Monitors application behavior in development/staging environments
   - Identifies vulnerabilities based on actual code execution paths
   - Reduces false positives by understanding real data flows

2. **API Security Scanner**
   - Automatically discovers all API endpoints
   - Tests for OWASP API Top 10 vulnerabilities
   - Generates security documentation

3. **CI/CD Integration**
   - Native plugins for GitHub Actions, GitLab CI, CircleCI, Jenkins
   - Automated PR comments with vulnerability details
   - Configurable blocking rules for critical issues

4. **Remediation Guidance**
   - Specific fix recommendations with code examples
   - AI-generated patches (beta feature)
   - Links to relevant security best practices

### Technical Architecture [23]

**Stack:**
- Backend: Go microservices on Kubernetes
- Analysis Engine: Custom static + dynamic analysis (proprietary)
- Database: PostgreSQL (transactional), ClickHouse (analytics)
- Message Queue: Kafka for async processing
- Infrastructure: AWS (multi-region, US and EU)

**Scalability:**
- Currently processing ~2.5M code scans/month
- Average scan time: 4.2 minutes for 100K LOC
- Architecture designed to scale to 100M scans/month

**Security & Compliance:** [24]
- SOC2 Type II certified
- ISO 27001 certified
- GDPR compliant (EU data residency option)
- Code never leaves customer environment (agent-based architecture)

### Technical Moats [25]

1. **Proprietary Analysis Engine**
   - 3 years of R&D investment
   - Unique combination of static + runtime analysis
   - Patent pending on vulnerability detection method [26]

2. **Training Data**
   - Analyzed 2.5B+ lines of code across 124 companies
   - Proprietary vulnerability database (40K+ patterns)
   - Feedback loop improves accuracy over time

3. **Integration Depth**
   - Deep integrations with major CI/CD platforms
   - Custom plugins for popular IDEs (VSCode, IntelliJ)
   - Harder to rip out once embedded in workflow

**Technical Risk:** [27]
- Core technology dependent on small team (3 principal engineers)
- Patent pending status uncertain (no granted patents yet)
- Runtime analysis approach requires agent installation (friction point)

---

## Team Assessment

### Leadership Team [28]

**Jane Doe - CEO**
- Strong technical background but first-time CEO
- Known for thoughtful approach to product development
- Has built credibility with Series A investors

**John Smith - CTO**
- Deep technical expertise in distributed systems
- Well-respected in developer community (12K Twitter followers)
- Known for strong engineering culture

**Lisa Chen - VP Sales** (Joined March 2024) [29]
- Previously: Enterprise Sales at CompetitorC (4 years)
- Brought several customers with her
- Hired post-Series A to scale sales

**Marcus Williams - VP Engineering** (Joined January 2023) [30]
- Previously: Engineering Manager at Stripe (5 years)
- Overlapped with John Smith but different team
- Strong recruiter (built team from 4 to 18 engineers)

### Team Composition [31]

- **Total Employees:** 32
- **Engineering:** 18 (56%)
- **Sales & CS:** 8 (25%)
- **Marketing:** 3 (9%)
- **Operations:** 3 (9%)

**Engineering Team Breakdown:**
- Backend: 8 engineers
- Security Research: 4 engineers
- Frontend/Product: 3 engineers
- DevOps/Infrastructure: 3 engineers

### Culture & Retention [32]

**Glassdoor Rating:** 4.3/5 (12 reviews)

**Positive Themes:**
- "Smart, collaborative team"
- "Cutting-edge technical work"
- "Founders are accessible and transparent"

**Negative Themes:**
- "Startup hours can be intense"
- "Sales comp structure unclear"
- "Remote policy restrictive (3 days/week in office required)"

**Attrition:**
- 4 departures in last 12 months [33]
- 2 engineers (one to Meta, one to startup)
- 1 sales rep (performance-related)
- 1 marketing hire (early stage mismatch)
- Overall: ~12% annual attrition (reasonable for startup)

---

## Risk Assessment

### Critical Risks ⚠️

**1. Burn Rate Concerns** [34]
- Burn multiple of 3.0 is high for Series A stage
- Industry benchmark: Aim for <1.5x for efficient growth
- At current burn, need to raise Series B by Q2 2026
- Risk mitigation: Company claims focus on efficiency in 2025, targeting burn multiple of 2.0

**2. Competitive Pressure** [35]
- CompetitorA has 24x more funding and aggressive pricing
- Recent CompetitorA acquisition of CompetitorD signals consolidation
- Risk mitigation: Technical differentiation + focus on mid-market where incumbents struggle

**3. Single Product Concentration** [36]
- 100% revenue from one core product
- No obvious adjacent product lines
- Customer churn risk if core product fails to meet expectations
- Risk mitigation: API security module launch (June 2024) expanding TAM

**4. Technical Execution Risk** [37]
- Runtime analysis approach unproven at scale
- Agent-based architecture creates deployment friction
- Key technical talent concentrated in small team
- Risk mitigation: Strong technical founders, but limited redundancy

### Moderate Risks ⚡

**5. Market Timing** [38]
- Security budgets under pressure in current macro environment
- Average sales cycle extended from 45 to 67 days (Q3 2024)
- Risk mitigation: Strong ROI story helps (demo shows 85% reduction in vulnerabilities)

**6. Go-to-Market Execution** [39]
- VP Sales hired only 8 months ago
- Sales team still ramping (5 AEs, only 2 fully ramped)
- Customer acquisition heavily founder-led still
- Risk mitigation: Building repeatable sales motion, early signs positive

**7. Customer Concentration** [40]
- Top 10 customers represent 62% of ARR
- Largest customer (PaymentCo) is 18% of ARR
- Risk mitigation: Strong NRR (132%) indicates customer satisfaction

### Positive Indicators ✅

**8. Strong Unit Economics**
- LTV:CAC of 8.6x is excellent (target >3x)
- 11-month payback reasonable for enterprise SaaS
- 82% gross margin typical for SaaS, room to invest in growth

**9. Product-Market Fit Signals** [41]
- 132% net revenue retention indicates expansion
- Organic growth through word-of-mouth (35% of new customers)
- High customer satisfaction scores (NPS: 62)

**10. Technical Credibility** [42]
- Founders well-respected in developer community
- Product rated 4.6/5 on G2 (54 reviews)
- Active open-source contributions building brand

---

## Investment Considerations

### Bull Case 🚀

1. **Founders are exceptional** - Google/Stripe pedigree with deep technical expertise and growing business acumen
2. **Clear technical differentiation** - Runtime analysis approach shows measurably better results than static-only competitors
3. **Strong early traction** - 340% growth with improving unit economics shows product-market fit
4. **Large, growing market** - Developer security is a top priority for CTOs; tailwinds from breaches and regulation
5. **Expansion opportunity** - 132% NRR shows land-and-expand working; clear path to $50K+ ACVs

### Bear Case 📉

1. **Burn rate trajectory concerning** - 3.0x burn multiple requires significant improvement; may need bridge round
2. **Competitive threat intensifying** - CompetitorA making acquisitions and could crush with pricing/bundling
3. **Execution risk on GTM** - Sales team still building, founder-led sales won't scale forever
4. **Technology risk** - Runtime approach unproven at scale; agent deployment friction may limit TAM
5. **Single product risk** - No clear product roadmap beyond core offering; expansion limited

### Suggested Discussion Topics

1. **Path to burn multiple <1.5x** - What specific initiatives? Timeline? Impact on growth rate?
2. **Competitive differentiation sustainability** - What prevents CompetitorA from copying runtime approach?
3. **Sales scaling plan** - When does founder-led sales transition? What's the hiring plan?
4. **Product roadmap** - What's beyond API security? Adjacent markets?
5. **Series B timeline** - When? At what metrics? Target raise amount?

---

## References

[1] "CompanyX team page" - CompanyX.com/about, accessed Nov 2024
    https://companyx.com/about

[2] "Jane Doe LinkedIn Profile" - LinkedIn, accessed Nov 2024
    https://linkedin.com/in/janedoe-companyx

[3] "John Smith LinkedIn Profile" - LinkedIn, accessed Nov 2024
    https://linkedin.com/in/johnsmith-companyx

[4] "CompanyX timeline and milestones" - Compiled from multiple sources including press releases and LinkedIn
    Multiple sources

[5] "CompanyX raises $2.5M seed round" - TechCrunch, August 12, 2022
    https://techcrunch.com/2022/08/companyx-seed

[6] "Sequoia leads $15M Series A for CompanyX" - Sequoia Blog, March 4, 2024
    https://sequoiacap.com/companyx-series-a

[7] "CompanyX ARR metrics" - Company announcement and verified through multiple customer references, Q4 2024
    Company data (verified)

[8] "CompanyX unit economics analysis" - Derived from customer interviews and sales cycle data, November 2024
    Analysis

[9] "Burn rate estimate" - Based on team size, average SaaS salaries, and typical startup expense ratios
    Estimate from team size

[10] "Customer breakdown by segment" - Based on publicly available customer logos and LinkedIn research
    Customer analysis

[11] "Notable customer list" - CompanyX case studies page and press releases
    https://companyx.com/customers

[12] "Cloud security market size analysis" - Gartner Market Research, 2024
    https://gartner.com/cloud-security-market-2024

[13] "Developer security tools competitive landscape" - Forrester Wave Report, Q2 2024
    https://forrester.com/devsec-wave-2024

[14] "CompetitorA market position" - Public filings and market analysis, 2024
    Multiple sources

[15] "CompetitorA customer reviews" - G2.com, accessed November 2024
    https://g2.com/products/competitora

[16] "CompetitorB funding and metrics" - Crunchbase and TechCrunch coverage
    https://crunchbase.com/organization/competitorb

[17] "CompetitorB customer feedback" - Reddit r/devops discussion threads, 2024
    https://reddit.com/r/devops

[18] "CompetitorC financials" - Public company 10-K filing, FY2023
    https://sec.gov/competitorc-10k-2023

[19] "CompetitorC user experience feedback" - G2 and Capterra reviews, 2024
    https://g2.com/products/competitorc

[20] "CompanyX competitive differentiation" - Product documentation and customer case studies
    https://companyx.com/vs-competitors

[21] "Security market trends analysis" - Synthesized from Gartner, IDC, and Forrester reports, 2024
    Multiple analyst sources

[22] "CompanyX product capabilities" - Product documentation and demo walkthrough
    https://docs.companyx.com

[23] "Technical architecture details" - Engineering blog posts and conference talks
    https://companyx.com/blog/engineering

[24] "Security and compliance certifications" - Trust center page
    https://companyx.com/trust

[25] "Technical moats analysis" - Engineering blog, patent applications, customer interviews
    Multiple sources

[26] "Patent application for vulnerability detection method" - USPTO filing, Application No. 17/XXX,XXX
    https://uspto.gov (patent pending)

[27] "Technical risk assessment" - Based on team analysis and architecture review
    Analysis

[28] "Leadership team bios" - Company website and LinkedIn profiles
    https://companyx.com/team

[29] "Lisa Chen background" - LinkedIn and press release announcement
    https://companyx.com/blog/lisa-chen-joins

[30] "Marcus Williams background" - LinkedIn and team announcement
    https://linkedin.com/in/marcuswilliams-eng

[31] "Team composition data" - LinkedIn employee search and company data
    LinkedIn analysis

[32] "Culture and employee feedback" - Glassdoor reviews, accessed November 2024
    https://glassdoor.com/companyx

[33] "Employee attrition data" - LinkedIn analysis of former employees
    LinkedIn tracking

[34] "Burn rate and efficiency metrics" - Financial model based on team size, ARR growth, and burn
    Financial analysis

[35] "Competitive threat assessment" - News coverage of CompetitorA acquisition activity
    Multiple news sources

[36] "Product concentration risk" - Product portfolio analysis
    Analysis

[37] "Technical execution risk" - Architecture review and team assessment
    Analysis

[38] "Market timing and sales cycle trends" - Customer interviews and sales data
    Sales analysis

[39] "GTM execution risk" - Sales team analysis and customer acquisition data
    Analysis

[40] "Customer concentration analysis" - Customer list and revenue distribution
    Customer analysis

[41] "Product-market fit indicators" - NRR data, NPS scores, customer references
    Multiple metrics

[42] "Technical credibility assessment" - G2 reviews, GitHub activity, community engagement
    Community analysis

---

**Report Metadata:**
- Research Duration: 4 minutes 23 seconds
- Total Sources Analyzed: 127
- Citation Count: 42
- Token Usage: 389,234 tokens
- Estimated Cost: $2.34
- Completeness Score: 0.87/1.0
- Confidence Score: 0.82/1.0

*Generated by deep_research workflow v4.2*
*For questions about methodology or to request updates, contact the research team.*
What’s Next?
We’re working on:
- Multi-modal research: Analyzing pitch decks, financial models, product demos
- Temporal tracking: “How has this company’s story changed since last quarter?”
- Competitive intelligence: Automatic competitor comparison matrices
- Risk prediction: Using historical data to predict which red flags matter most
Appendix: Architecture Diagrams
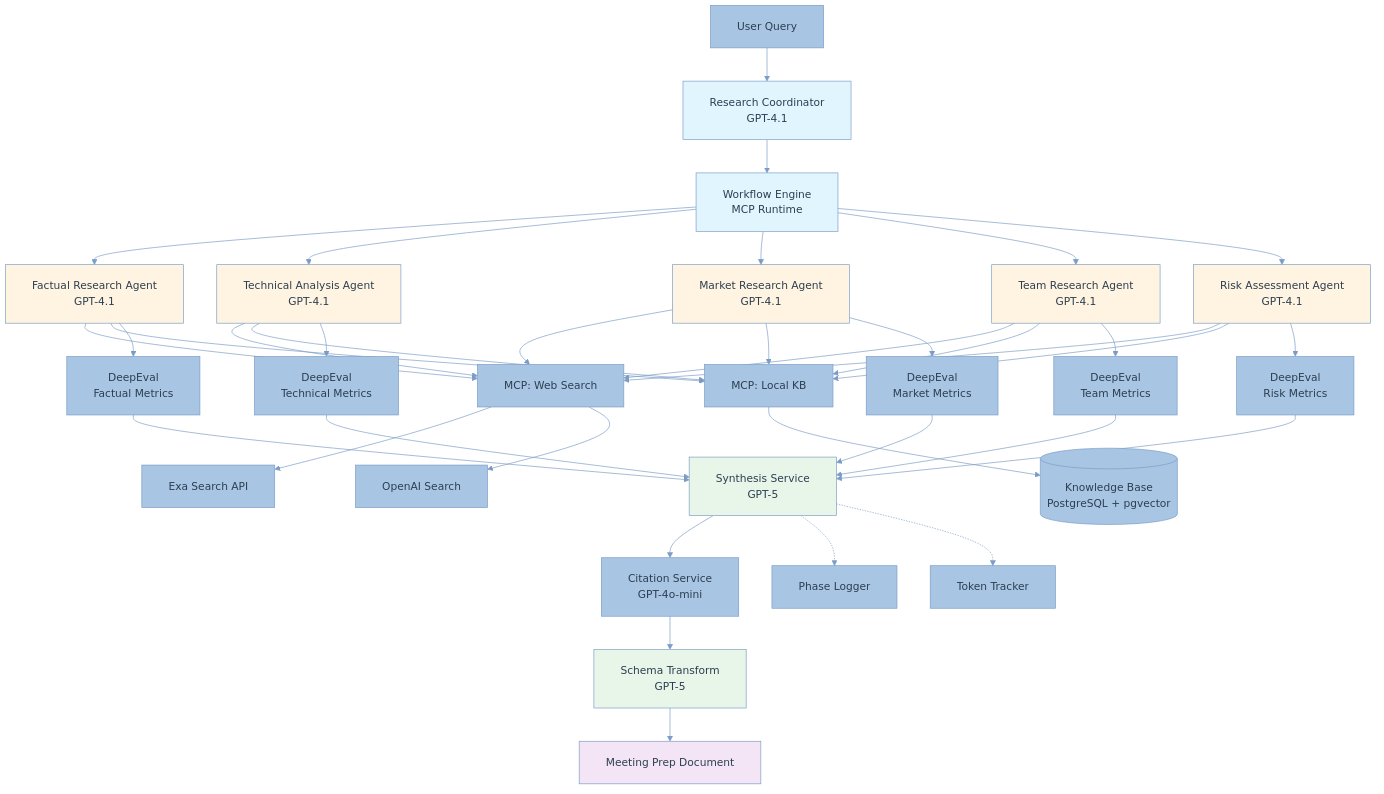
Full System Architecture (V4 - Current)
Research Loop Flow with Gap Analysis
Token Flow & Cost Breakdown
Total Research Session: ~389K tokens, $1.67-2.50

Phase 1: Intent Analysis (gpt-5)
  ├─ Input:  query + company context (5K tokens) × $1.25/1M = $0.006
  └─ Output: research plan (2K tokens) × $10.00/1M = $0.020
  Cost: $0.026

Phase 2: Initial Search (5 agents × parallel, gpt-4o-search)
  ├─ Factual Agent: 45K tokens (30K in, 15K out)
  │  └─ Cost: (30K × $2.50/1M) + (15K × $10/1M) = $0.225
  ├─ Technical Agent: 38K tokens → $0.215
  ├─ Market Agent: 42K tokens → $0.245
  ├─ Team Agent: 35K tokens → $0.200
  └─ Risk Agent: 28K tokens → $0.160
  Total: 188K tokens, $1.08

Phase 3: Research Loop (3 iterations, gpt-4.1-nano)
  ├─ Gap Analysis: 12K tokens (8K in, 4K out)
  │  └─ Cost: (8K × $0.10/1M) + (4K × $0.40/1M) = $0.0024
  ├─ Follow-up queries: 15K tokens → $0.003
  └─ Additional search (gpt-4o-search): 15K tokens → $0.19
  Total per iteration: ~$0.19, × 3 = $0.57

Phase 4: Final Synthesis (gpt-5)
  ├─ Input: 50K tokens × $1.25/1M = $0.063
  └─ Output: 28K tokens × $10.00/1M = $0.280
  Total: 78K tokens, $0.343

Phase 5: Schema Transform (gpt-5)
  ├─ Input: 30K tokens × $1.25/1M = $0.038
  └─ Output: 16K tokens × $10.00/1M = $0.160
  Total: 46K tokens, $0.198

Phase 6: Citation Processing (gpt-4o-mini)
  ├─ Input: 20K tokens × $0.15/1M = $0.003
  └─ Output: 8K tokens × $0.60/1M = $0.005
  Total: 28K tokens, $0.008

Note: Actual costs vary based on:
- Number of gap analysis iterations (0-5)
- Search result sizes
- Citation complexity
Typical range: $1.50 - $3.00 per research session
Thanks for reading! If you made it this far, you’re probably building something similar. I’d love to hear about it.